Tutorial: Temperature dependence from a series of Bruker 2D spectra in JCAMP-DX format
Introduction
- As introduced in the multi-block JCAMP-dx tutorial, JCAMP-DX formats support a wide range of instruments, including NMR spectrometers.
- Bruker, Agilent(Varian), and JOEL can export their NMR FID or Fourier transferred spectra into JCAMP-DX NMR format.
- In this tutorial, a temperature-dependent series of TROSY spectra are
converted into
JCAMP-DXfiles by Bruker Topspin and processed by TREND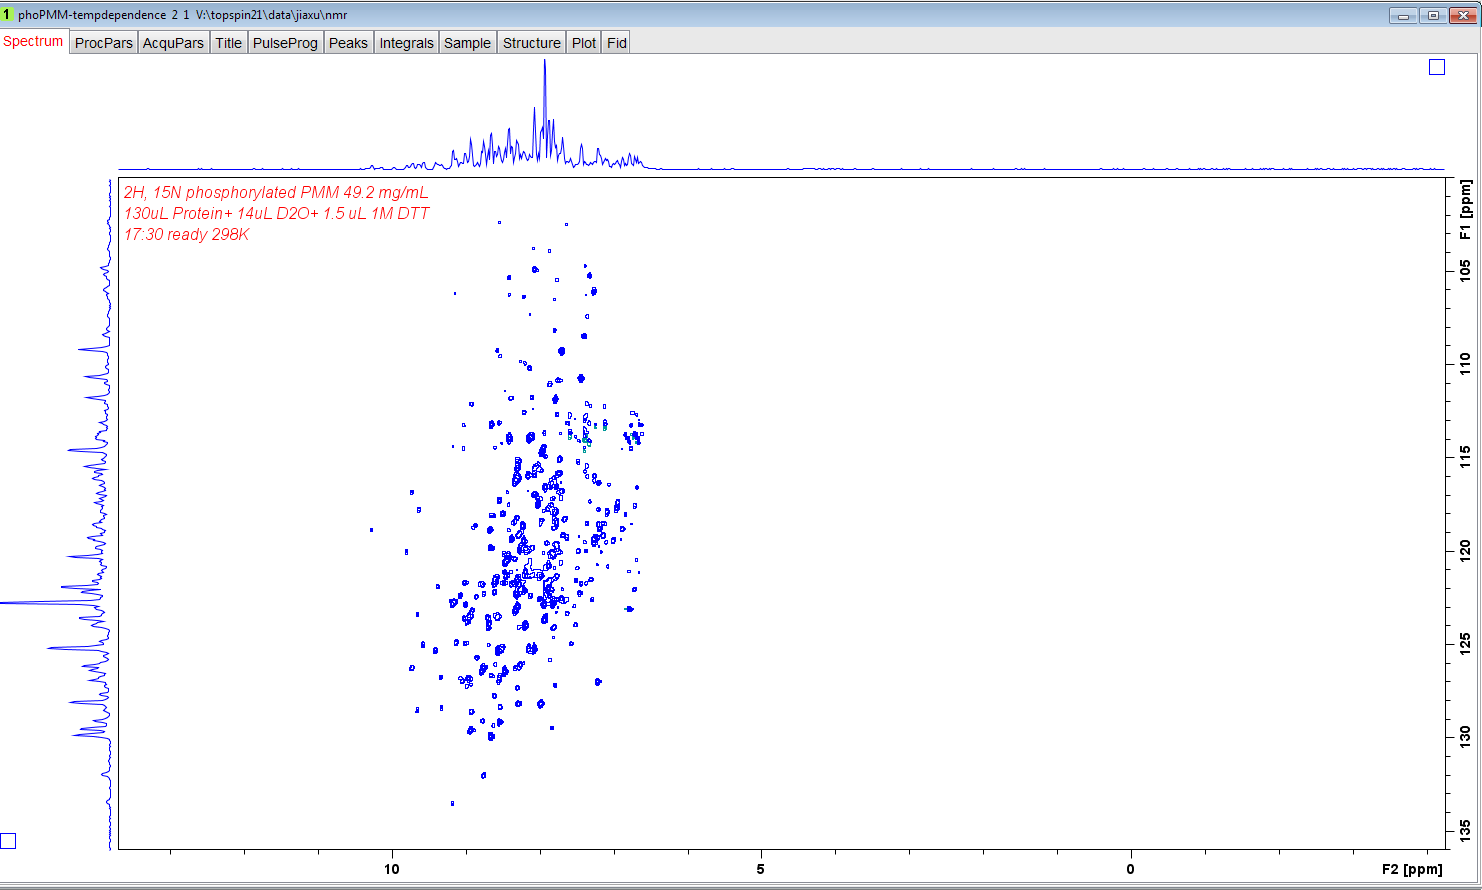
1. Convert spectra into JCAMP-DX format
- In topsin, open the dataset to save, Run
tojdxcommand, or choose File -> Save menu, chooseSave data set in a JCAMP-DX file.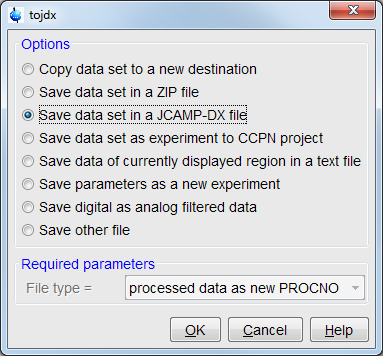
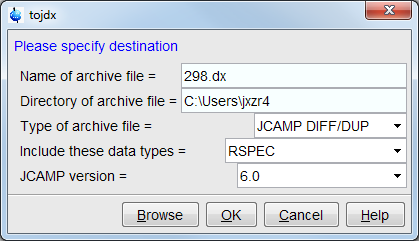
- Then set
Type of archive fileasJCAMP IDFF/DUP, which is a data compression method - Set "Include these data types" as "RSPEC", which means only the real part
spectra will be saved. (Topspin does not support saving complex part of
2D and higher dimensional data).
- The resulting JCAMP-DX file contains all of the spectral parameters, such as
##TITLE=2H, 15N phosphorylated PMM 49.2 mg/mL 130uL Protein+ 14uL D2O+ 1.5 uL 1M DTT 17:30 ready 298K ##JCAMPDX= 6.0 $$ Bruker NMR JCAMP-DX V2.0 ##DATA TYPE= nD NMR SPECTRUM ##DATA CLASS= NTUPLES ##NUM DIM= 2 ##ORIGIN= Bruker BioSpin GmbH ##OWNER= jxzr4 $$ 1.83.2.2.2.1 TOPSPIN Version 3.2 $$ 2016-11-21 16:50:13.848 -0600 TIGERS\jxzr4@BCHEM-MTHOOD7 $$ Compression mode = diff/dup ##.OBSERVE FREQUENCY= 800.147784601106 ##.OBSERVE NUCLEUS= ^1H ##.ACQUISITION MODE= SIMULTANEOUS (DQD) ##.ACQUISITION SCHEME= Echo-Antiecho ##.AVERAGES= 32 ##.DIGITISER RES= 22 ##SPECTROMETER/DATA SYSTEM= spect ##.PULSE SEQUENCE= b_trosyetf3gpsi ##.SOLVENT NAME= H2O+D2O ##.SHIFT REFERENCE= INTERNAL, H2O+D2O, 1, 10.55175 ##AUDIT TRAIL= $$ (NUMBER, WHEN, WHO, WHERE, PROCESS, VERSION, WHAT) $$ ##TITLE= Audit trail, TOPSPIN Version 3.2 $$ ##JCAMPDX= 5.01 $$ ##ORIGIN= Bruker BioSpin GmbH $$ ##OWNER= jxzr4NTUPLEflags are spectra data points, e.g.:##NTUPLES= nD NMR SPECTRUM ##VAR_NAME= FREQUENCY1, FREQUENCY2, SPECTRUM ##SYMBOL= F1, F2, Y ##.NUCLEUS= 15N, 1H ##VAR_TYPE= INDEPENDENT, INDEPENDENT, DEPENDENT ##VAR_FORM= AFFN, AFFN, ASDF ##VAR_DIM= 1024, 512, 512 ##UNITS= HZ, HZ, ARBITRARY UNITS ##FACTOR= 2.85073081136719, 7.01553520114943, 1 ##FIRST= 11026.7633587518, 3584.93848778736, 59843 ##LAST= 8110.46573872317, 0, 114128 ##MIN= 8110.46573872317, 0, -28692053 ##MAX= 11026.7633587518, 3584.93848778736, 434652230 ##PAGE= F1=11026.76335875 ##FIRST= 11026.7633587518, 3584.93848778736, 59843 ##DATA TABLE= (F2++(Y..Y)), PROFILE 511E9843K28587L71399J71595j27870B98455a39447j60615g0562C61445K88667 501F50112o8960A49008d27817k73897K66384D080J60198o5687c7512j30016j85721 490c53249k78022k37360J1398P3379J9158L03591E2916K79358j56003c8534F6056 478C67966J72514o4394k25803h0426m50052m14212o5060K62894L25962a64831 467a00860j32439j34424j45489l05759l51794J02464N29787a83818O349M831A27131 455D77261L1295k46188A09471P3478J97798R6259k21739a51898m02660n782a64097 443G8735i7959j11726e5991f938k71003l06782r0791L9382l3312j91345m2053 432i02842d01148E08379O13972k01345B36027a24369A22815K25456h2299p73502 422h55801k85067L70445c40540P9926k8334J15858o955j81836J1279d857B35563 410I9798e8704j08244k9053c4285C88374M55663l339C80548g219A3717K03582 399B17299Q3553A26178a34453j51309e1572D20383M24262J11290l34543A34421 388c10673j26656J79057C6952b2934l62655k52432Q8648b68527a32151c8836A08259 376A25876a84763l97725j21897K02392O8110l03568m69443l31490l0532K33088 366a335828M97431c81329h3708C06830N25625L06384k22775B91428b83843o7584
2. Prepare X axis file (optional)
We can prepare an X axis file containing temperatures for this spectra
as temp.txt:
298
300
302
304
306
308
3. Do PCA analysis on the JCAMP-DX series
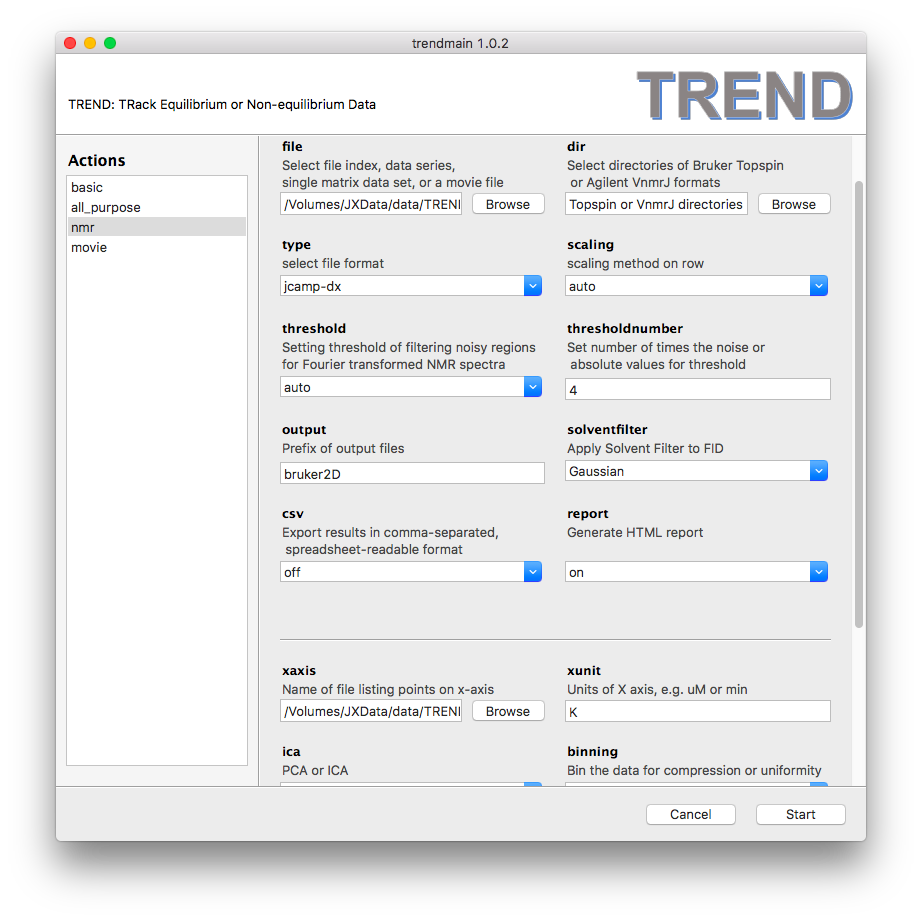
- Launch
trendmainguiand choose JCAMP-DX files: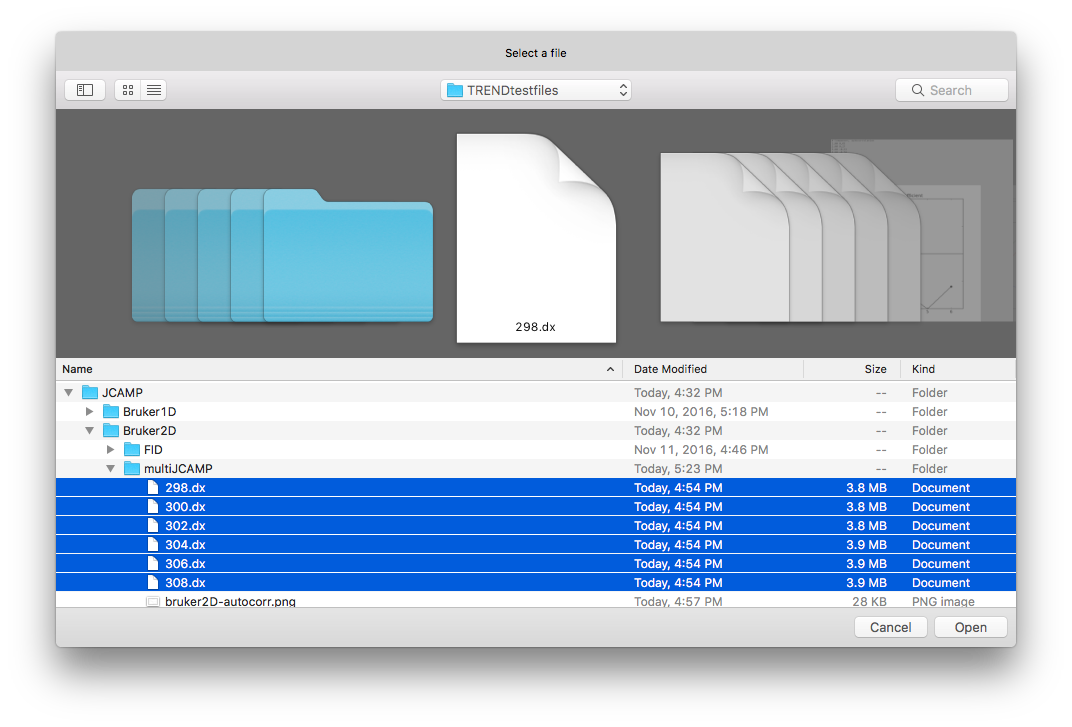
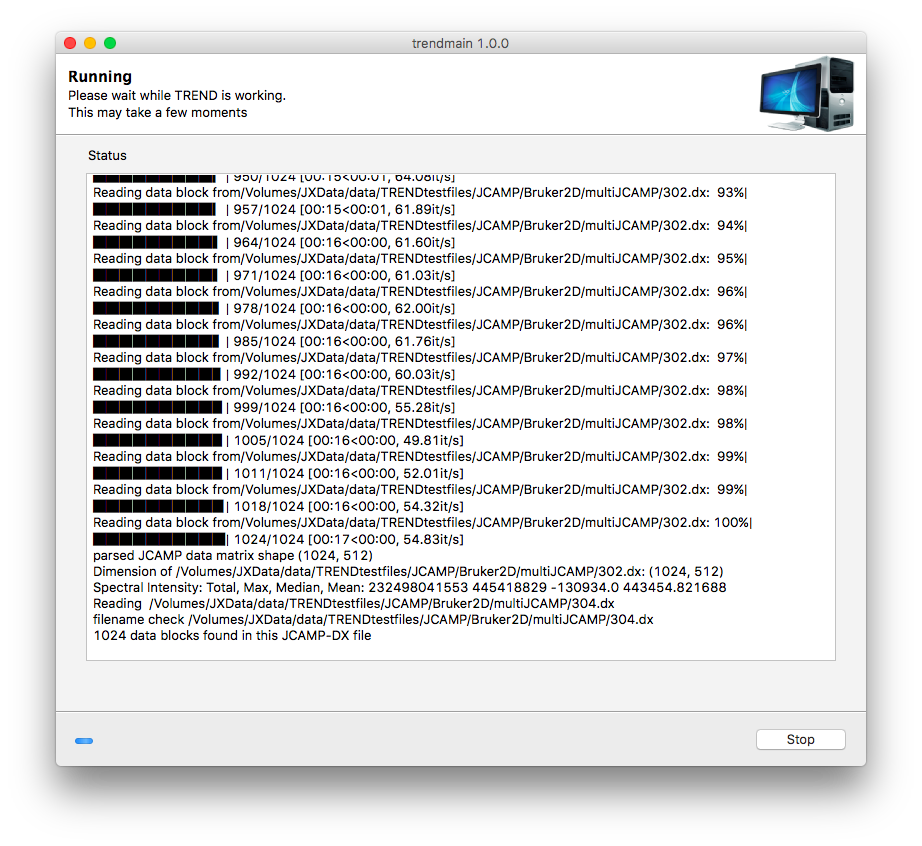
- Press "Start" button, TREND will start working (decoding JCAMP-DX
is slower than other formats, please wait patiently)
- When the calculation finishes, the results can be seem in the html report:
