Tutorial: Kinetics of Visible Spectra in one JCAMP-DX file: the Aquation of trans-[Co(en)2Cl2]+
Introduction
- JCAMP-DX is an internationally accepted format that is suitable for spectra collected from a wide range of methods, spectroscopy, and instrumentation. A single JCAMP-DX spectrum can store a series of spectra using multi BLOCKS
- Here is a simple example of obtaining the kinetics of aquation of trans-[Co(en) 2Cl2]+ from a single JCAMP-DX file, which includes a series absorbance (Vis) spectra using 5 data blocks.
- More examples of JCAMP-DX data can be found at http://wwwchem.uwimona.edu.jm:1104/spectra/testdata/index.html
Basic information on the experiments can be found in the header of the downloaded
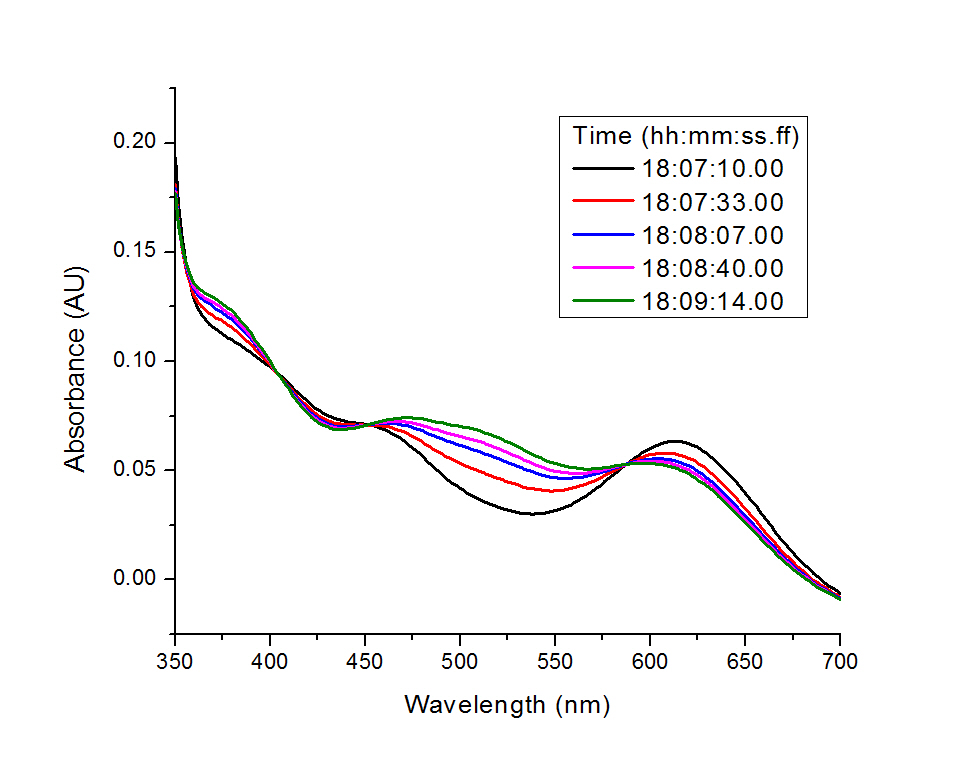
blckpac1.jdxfile:##TITLE= Aquation of trans-[Co(en)2Cl2]+ ##DATA TYPE= LINK ##BLOCKS= 5 ##ORIGIN= Dept of Chem, UWI, Mona, JAMAICA ##OWNER= public domain ##TITLE= (t1) Aquation of trans-[Co(en)2Cl2]+ ##JCAMP-DX= 4.24 ##DATA TYPE= UV/VIS SPECTRUM ##BLOCK_ID=1 ##ORIGIN= Dept of Chem, UWI, Mona, JAMAICA $$Exported PE UV WinLab Data File ##OWNER= public domain ##DATE= 96/11/04 ##TIME= 18:07:10.00 ##SPECTROMETER/DATA SYSTEM= PERKIN-ELMER LAMBDA 19 UV/VIS/NIR UVThe Vis spectra series are displayed here with their time stamps:
Steps
1. Prepare xaxisfile by extracting time information from all blocks (Optional)
The time courses of the aquation of trans-[Co(en)2Cl2]+ was recoreded in this example. This time at which each spectrum(block) was collected is given
by the##TIMEfield, for example:##TIME= 18:07:10.00Although TREND does not need the temporal information to perform PCA analysis on this kinetic experiment, it will be needed to plot the time-course of the reaction with its time scale.
- Since the
x axispoints inxaxisfilemust be integer or floating point numbers, these need to be extracted from the JCAMP-DX (.jdxor.dx) file.
1.1. Extract time information
I. This can be done manually or running the following command in a Linux or macOS terminal using this syntax:cat blckpac1.jdx |grep "TIME"|awk '{print $2}' > time.txtII. Then the
time.txtcontains the following lines:18:07:10.00 18:07:33.00 18:08:07.00 18:08:40.00 18:09:14.001.2. Convert
time.txttoxaxisfile
I. Opentime.txtusingExcelorOpenOffice
II. Convert time to seconds inExcel
The time format in the A column ishh:mm:ss.ff, the simplest way is to convert time to units of seconds in column B, using the formula depicted. This may require first setting the format of the cells of column B to "general".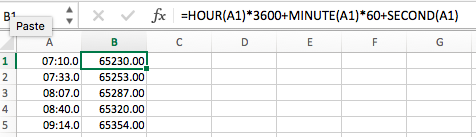
III. Calculate time change as difference between each time point to the first time point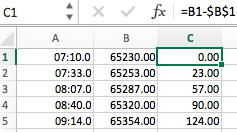
IV. Now save the column C to a filex-axis.txt, which will be used asxaxisfilefortrendmainortrendplot0.00 23.00 57.00 90.00 124.00
2. Do PCA on the multi-block JCAMP-DX file
2.1 First launch trendmaingui, and specify options as illustrated in the menu: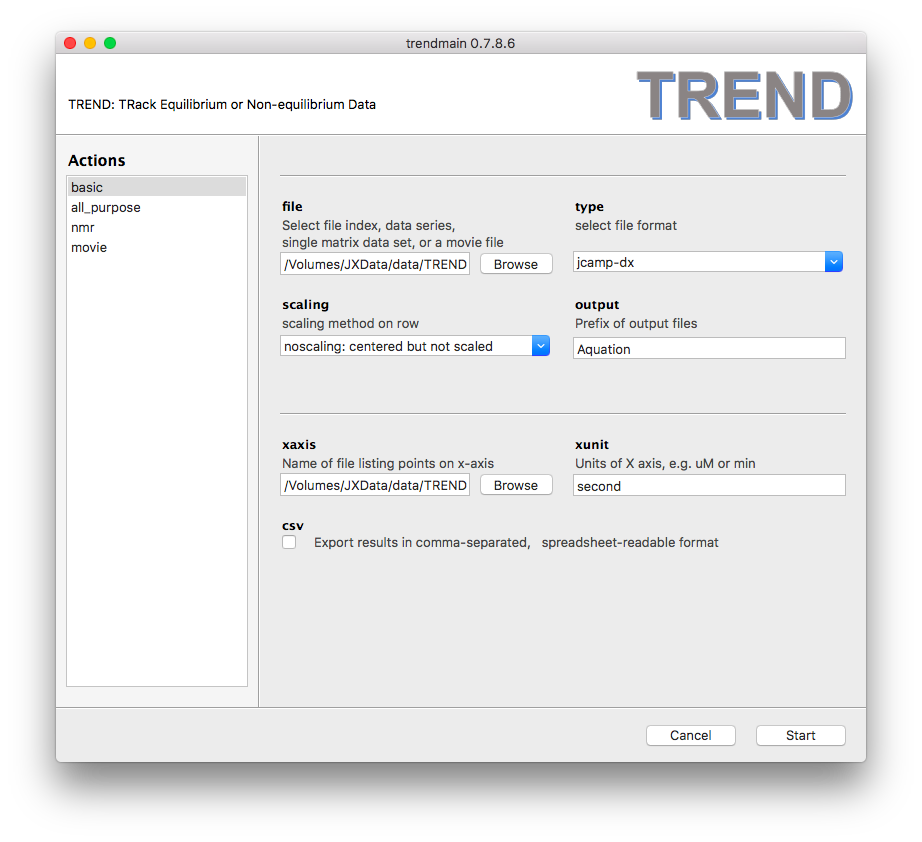
2.2 Press the Start button, TREND will run quickly, resulting in text
appearing in the window as shown: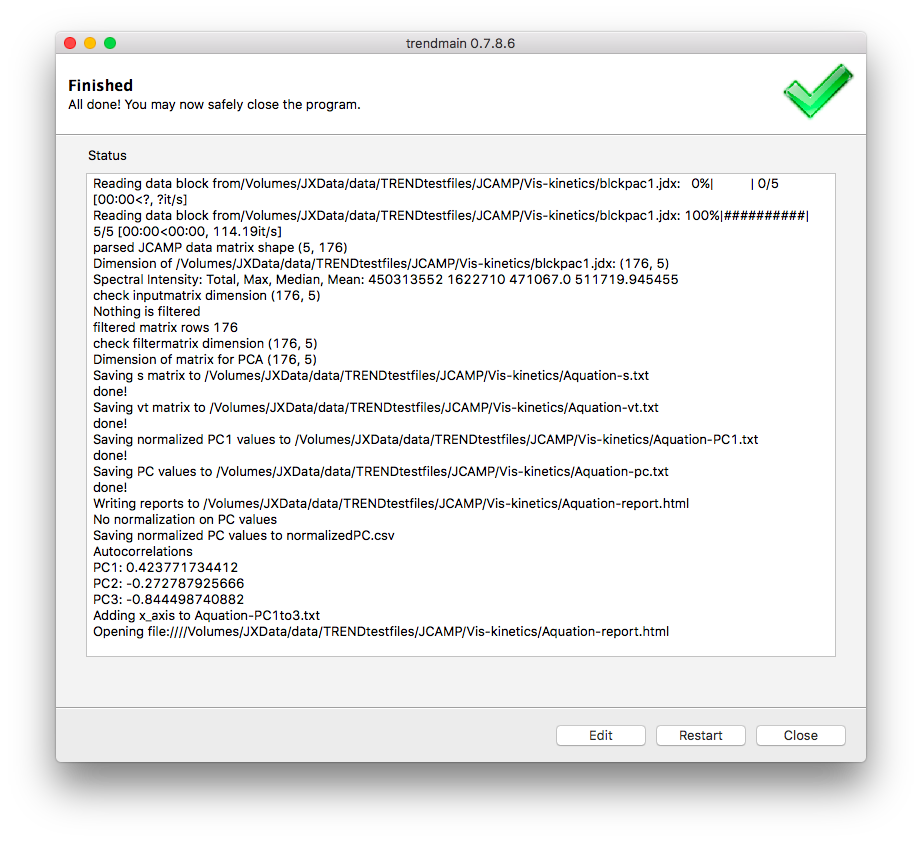
The corresponding command is:
trendmain.exe -f blckpac1.jdx -t jcamp -s noscaling -x x-axis.txt -u second -o Aquation --report
2.3 After trendmain finishes, a report in HTML format appears, and in this example is named
Aquation-report.html. Its scree plot (a bar chart) indicates that there is only principal
component.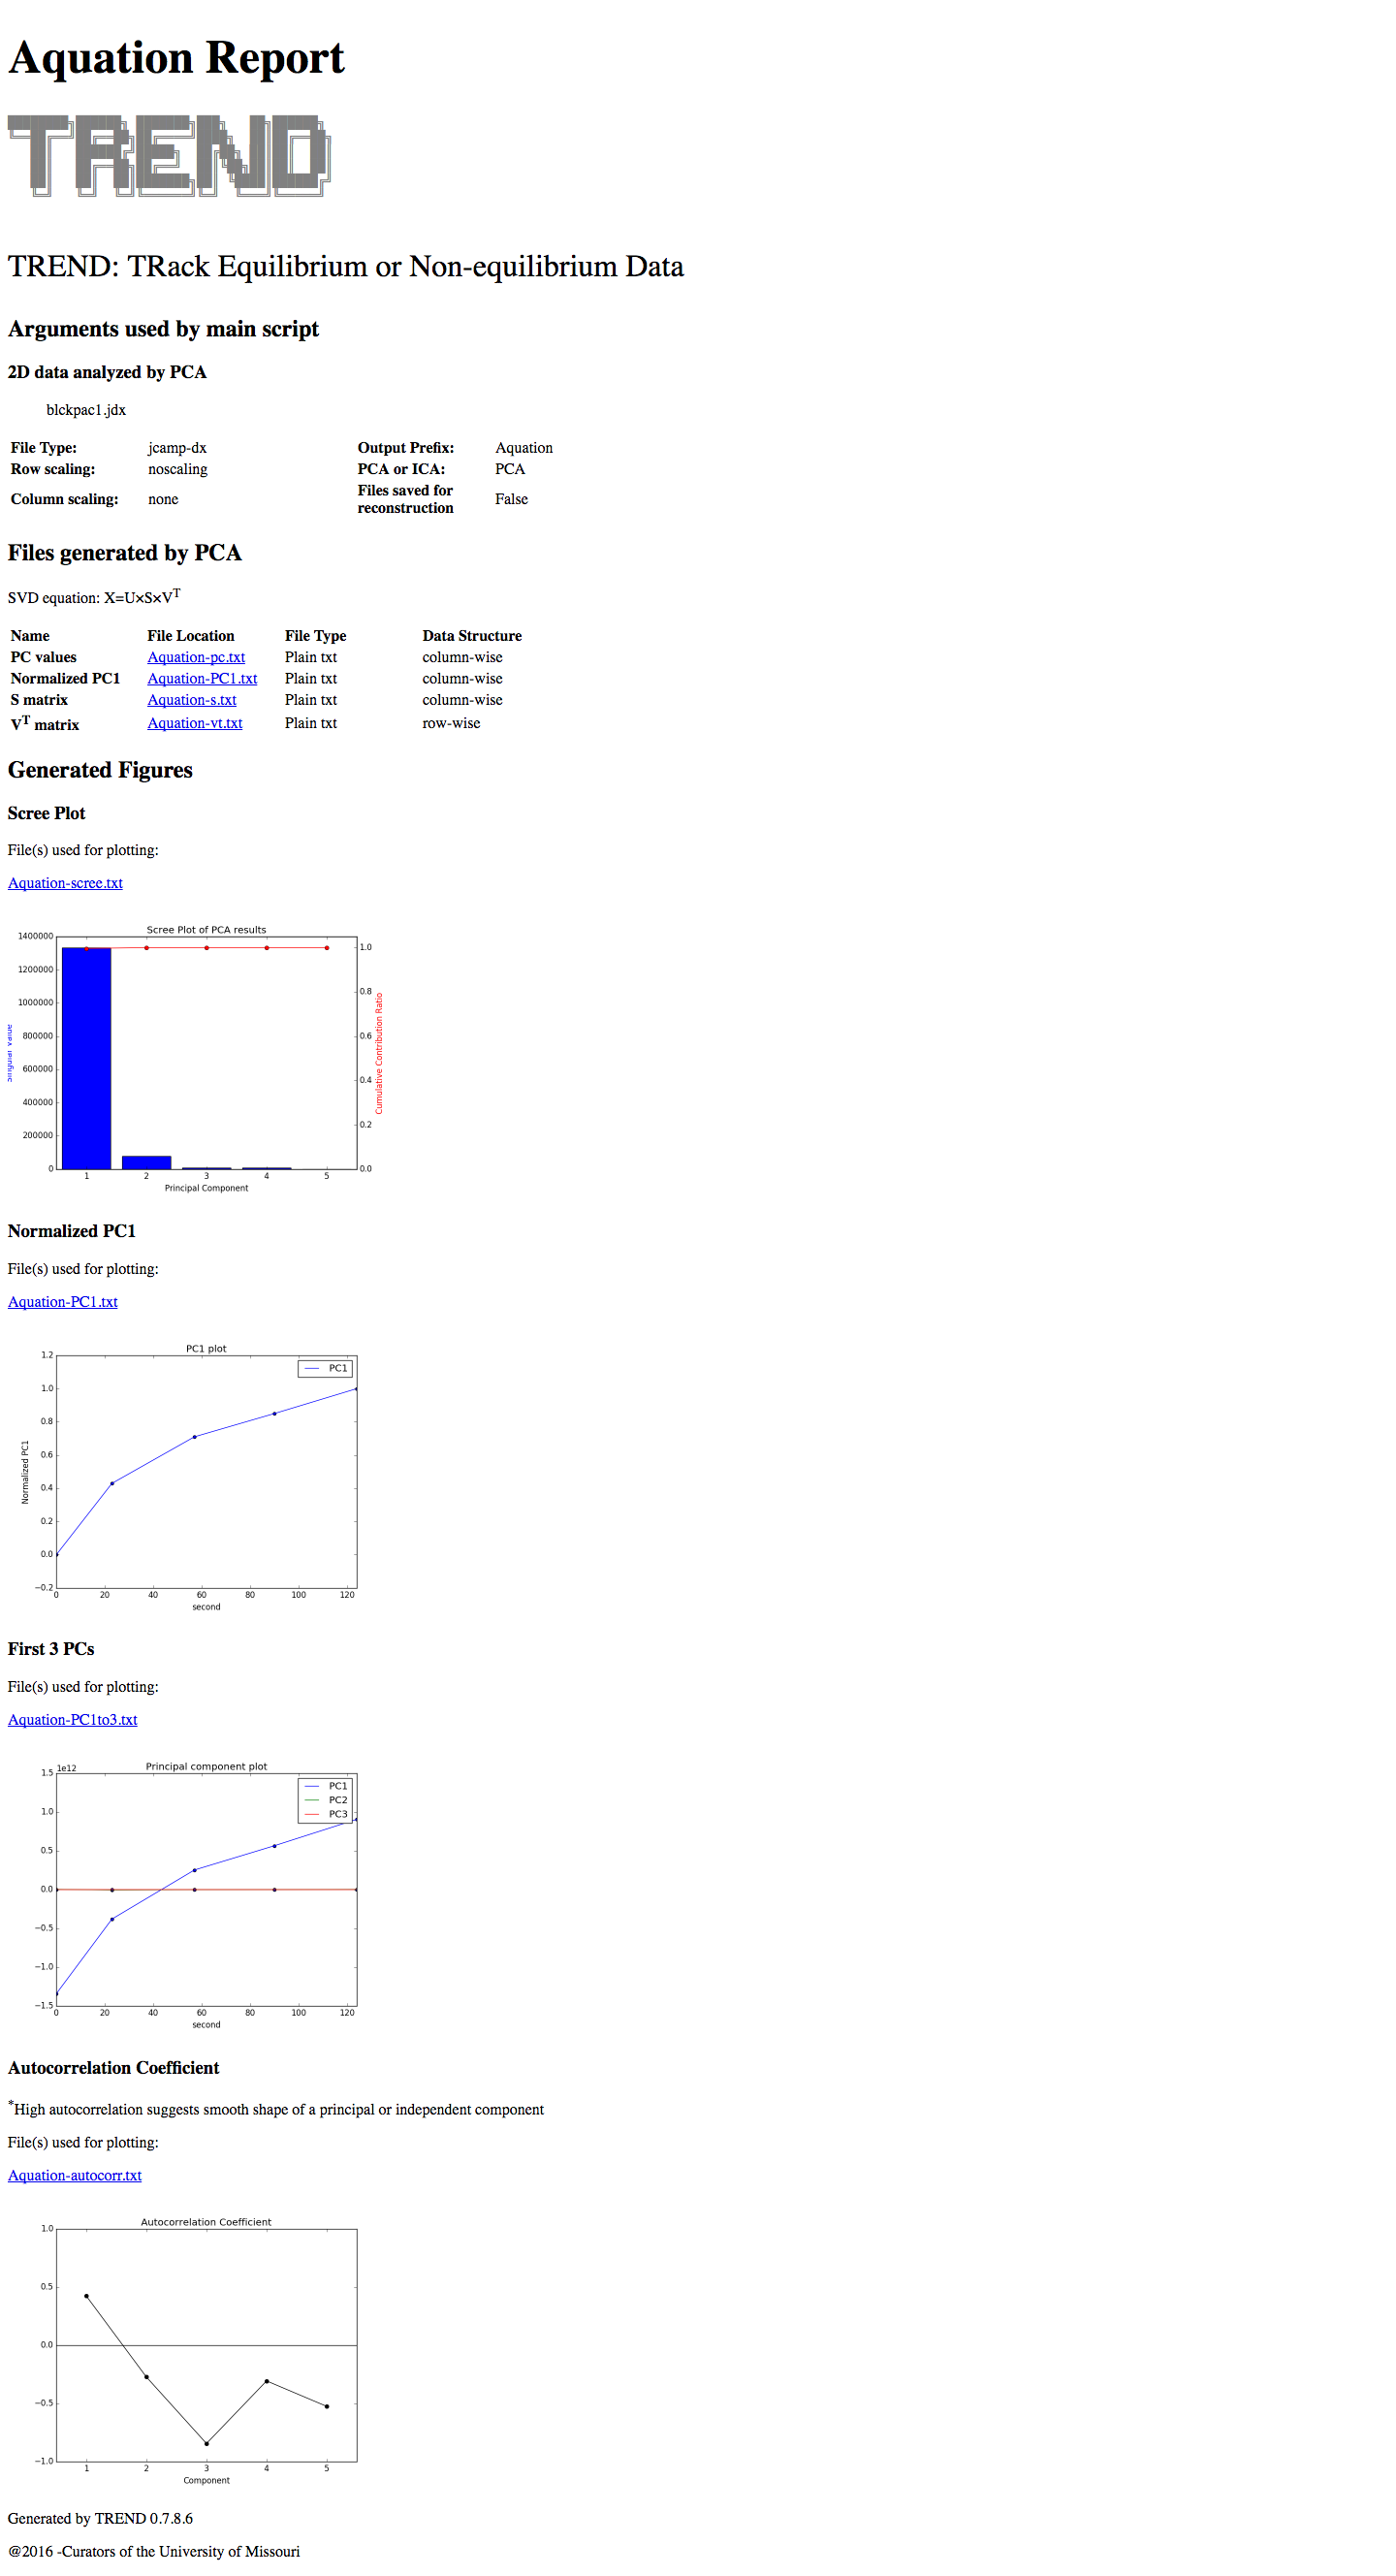
Note that TREND does not currently support reconstruction of JCAMP-DX files.