Tutorial: Extract binding isotherms from unprocessed Agilent (Varian) FID
The example is a titration example of Varian format.
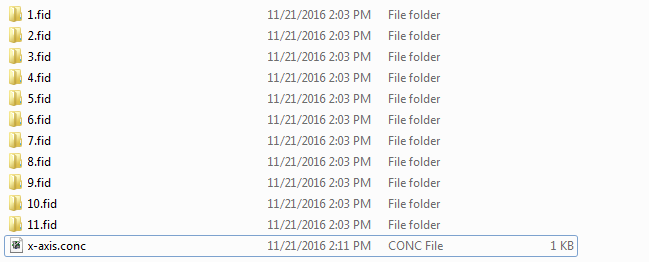
In each folder (e.g. 1.fid), there are just 4 files, which are fid,
log, procpar, and text, which are not processed.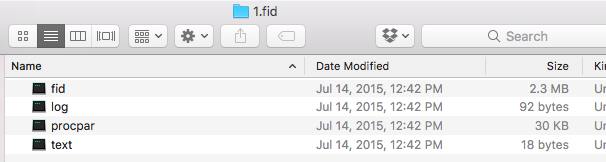
1. (optional) make X axis file
create an x-axis.conc using any text editor in the following format:
0.0
0.25
0.5
1.0
1.33
1.67
1.75
2.0
2.5
3.0
4.0
2. Do PCA on FID series
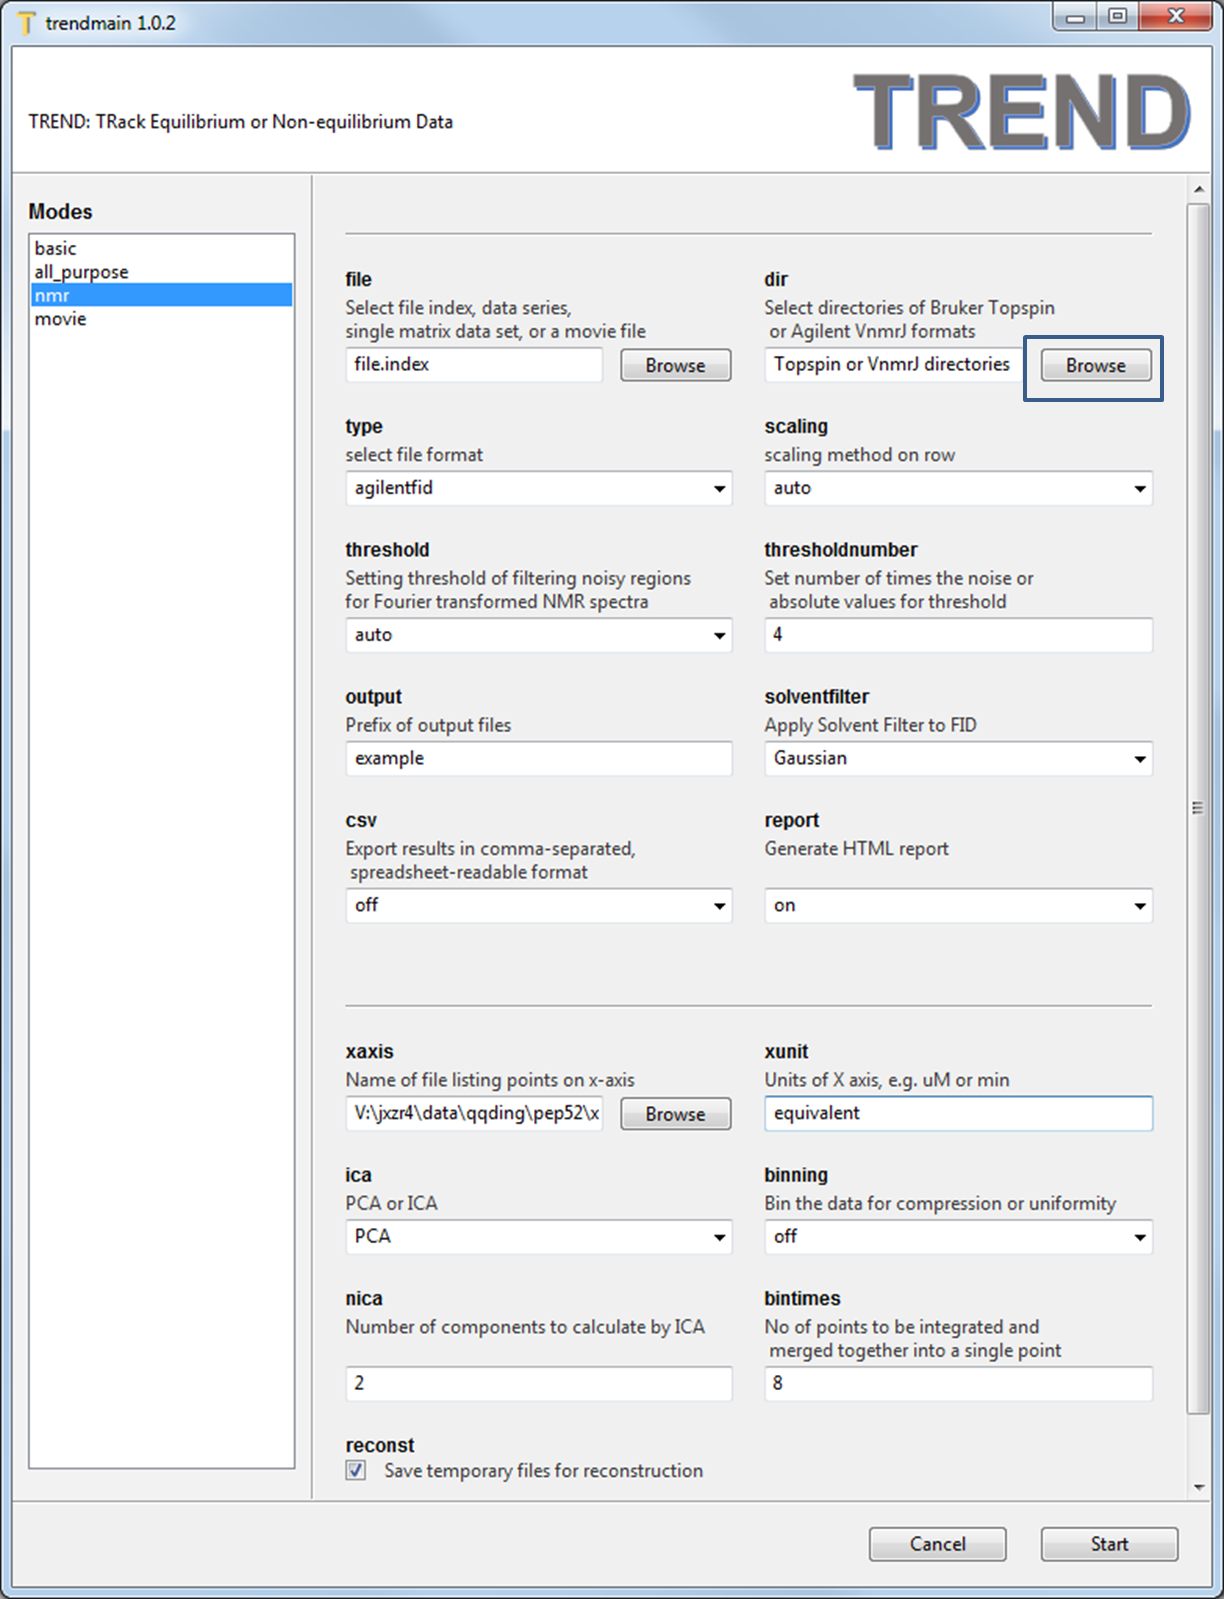
- Launch
trendmaingui, pressBrowsebutton ofdirtextbox to select all folders. - Note don't change
filetextbox as in the A simple example because the Agilent and Topspin data formats are directories, whilefileis used to choose single files.
- Set
typeasagilentfid,scalingasauto, xunit asequivalence, and readx-axis.concfile usingxaxistext box. For the FID data,solventfiltercould be applied to suppress solvent peaks. Here the defaultGaussianis used. - Press the 'Start' button, the html report will be generated if
reportoption is turned on.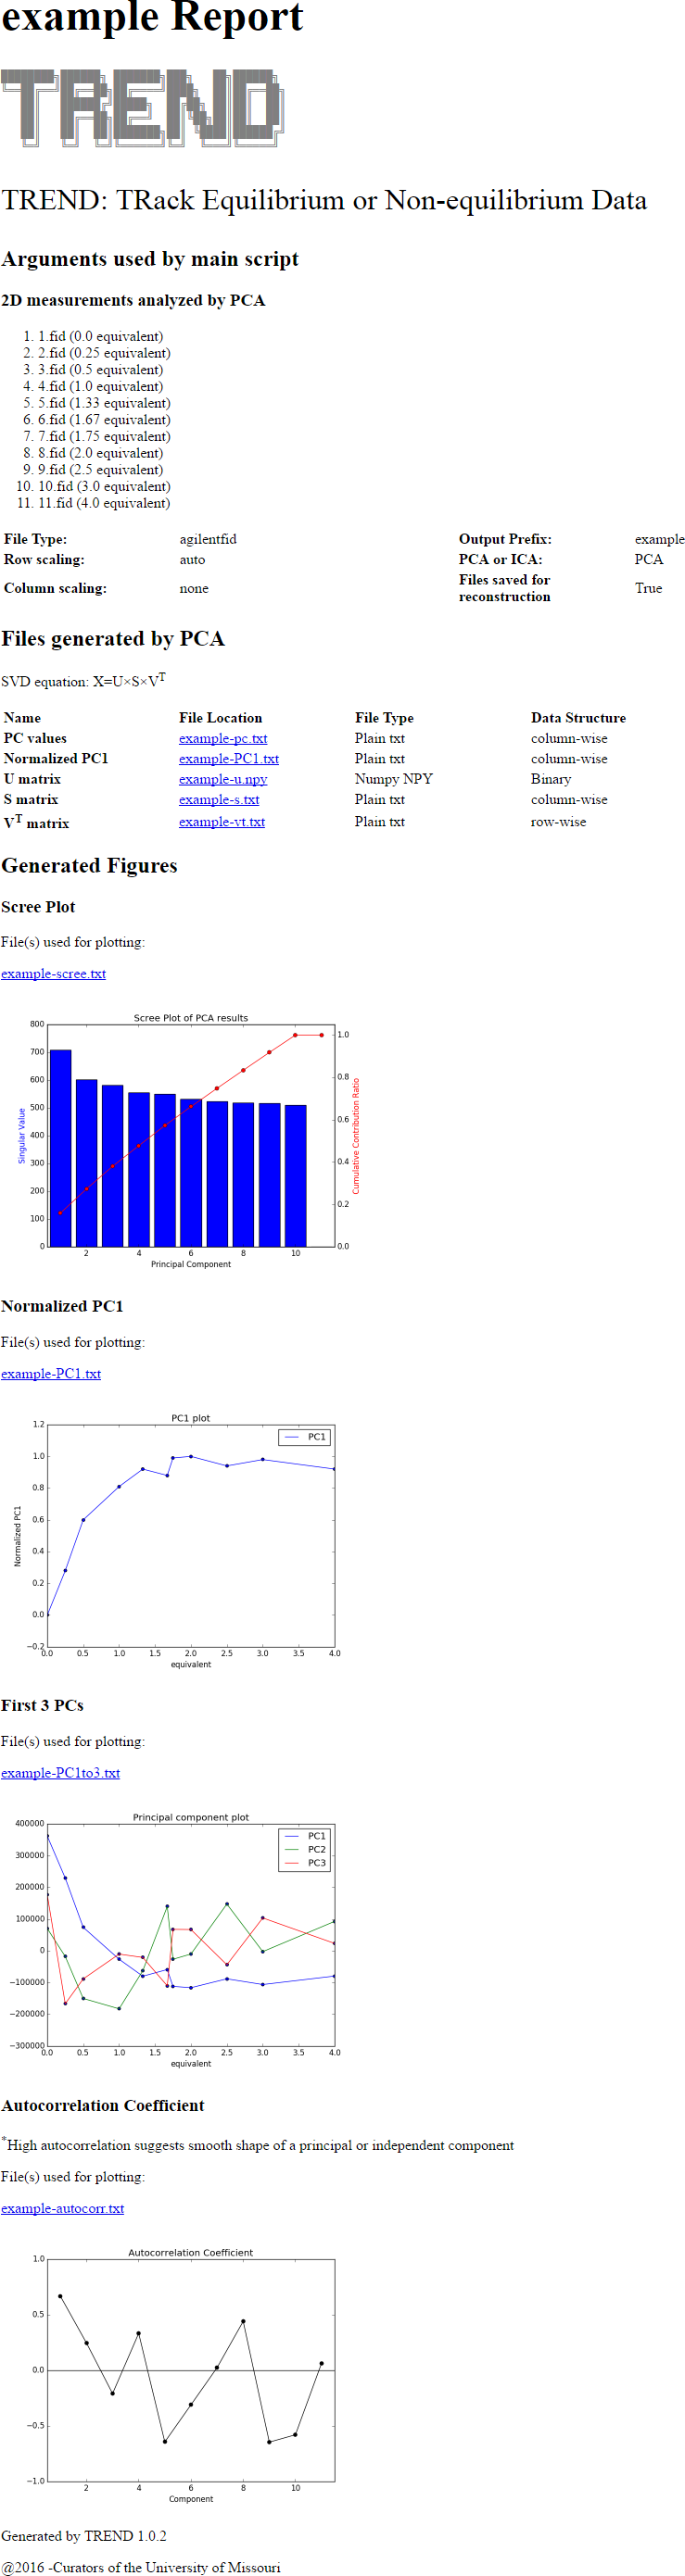
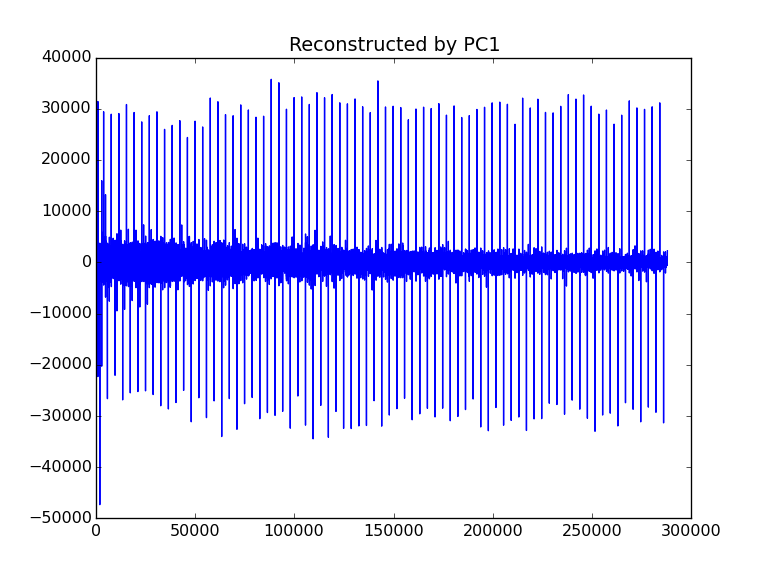
3. Reconstruct Agilent FID using only the first component
- Luanch and run
trendreconstructguiusing default parameters,
- A subfolder named as
reconst(which is defined by theoutputoption) is generated. The subfolder contains the reconstructed FID series with the same names of input files. They can be processed as the normal Agilent FID data. - The original
1.fidhas the spectrum as (processed by NMRPipe):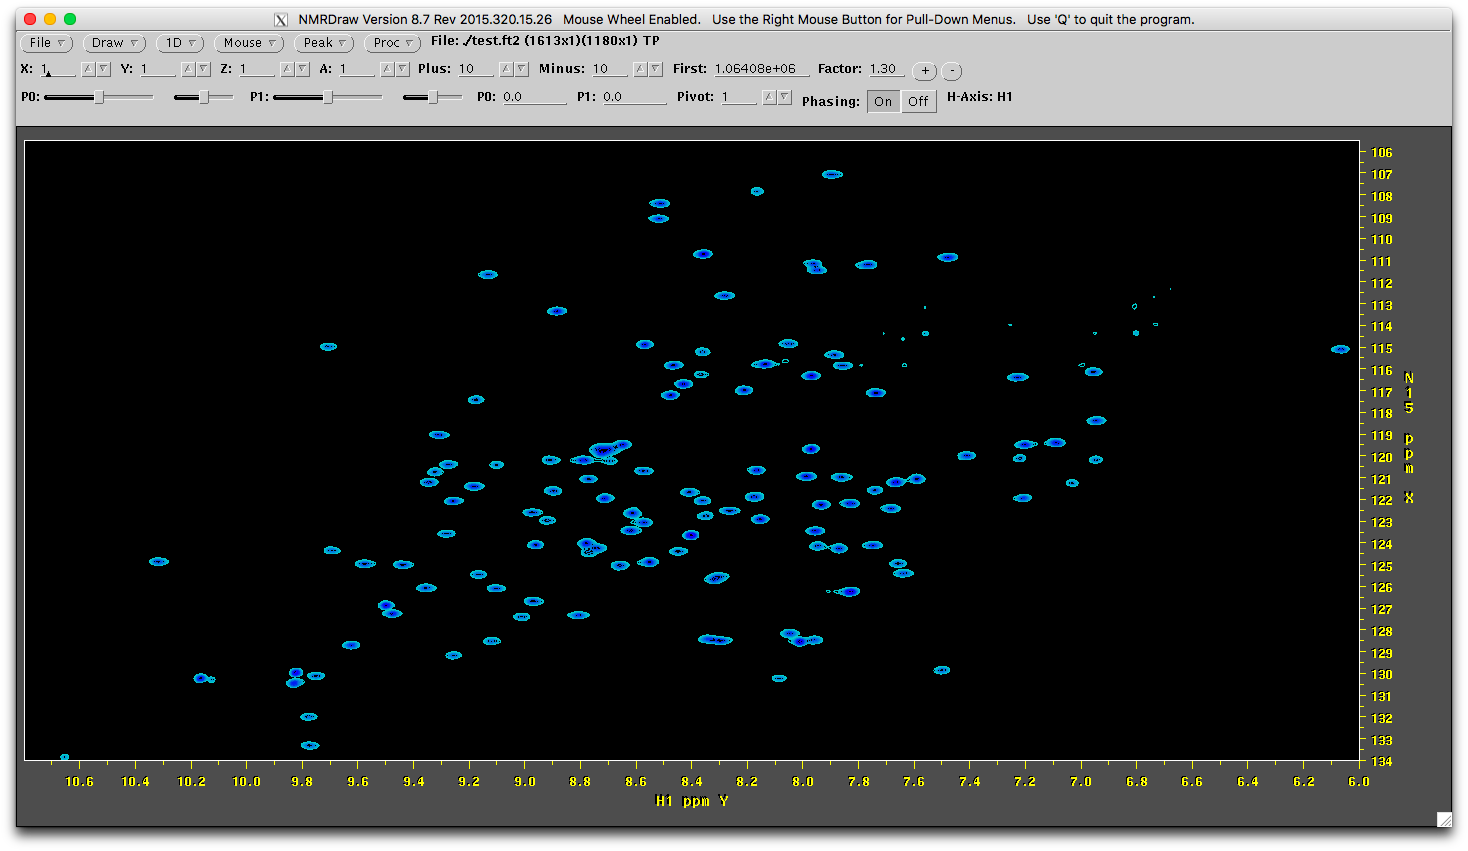
- The reconstructed
1.fidhas a similar but different spectrum (processed by NMRPipe using the same NMRPipe scripts).
- You can also visualize the reconstructed FIDs directly by choosing
exportformat asPNG.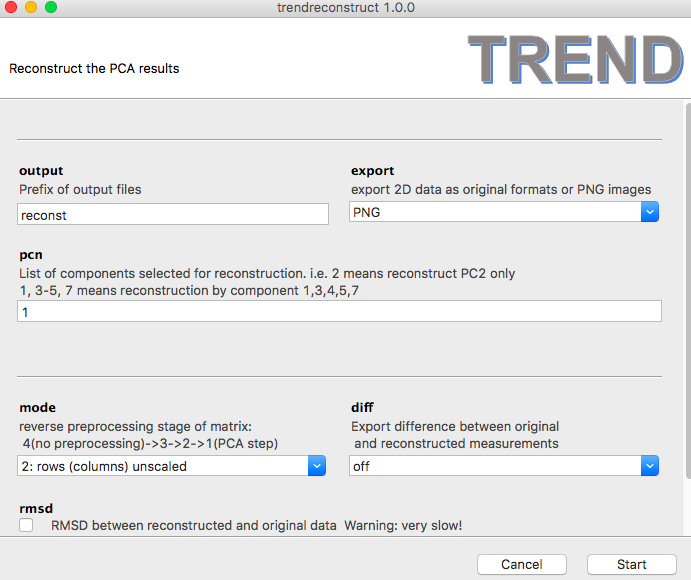
- Then a series of PNG images named as
reconstX.pngwill be generated. For example,reconst1.pngis shown as: