Trendplot -- display the principal components identified by the main script
- The program for plotting with GUI is
trendplotgui.exe in Windows and
Linux, or trendplotgui.app ini OS X. Since the report option of the main
script generates an HTML report with several figures including the
first 3 PCs and scree plot, trendplotgui is optional for visualizaing
results. However, trendplotgui.exe provides more control of the number
of components to plot and how they should be normalized.
- Note that each time when
trendmaingui launches it creates a temp directory to
save temporary files for trendplotgui and trendreconstructgui and
deletes the old one (if it exists). This poises trendplotgui and
trendreconstructgui to read in the results from the last run of trendmaingui.
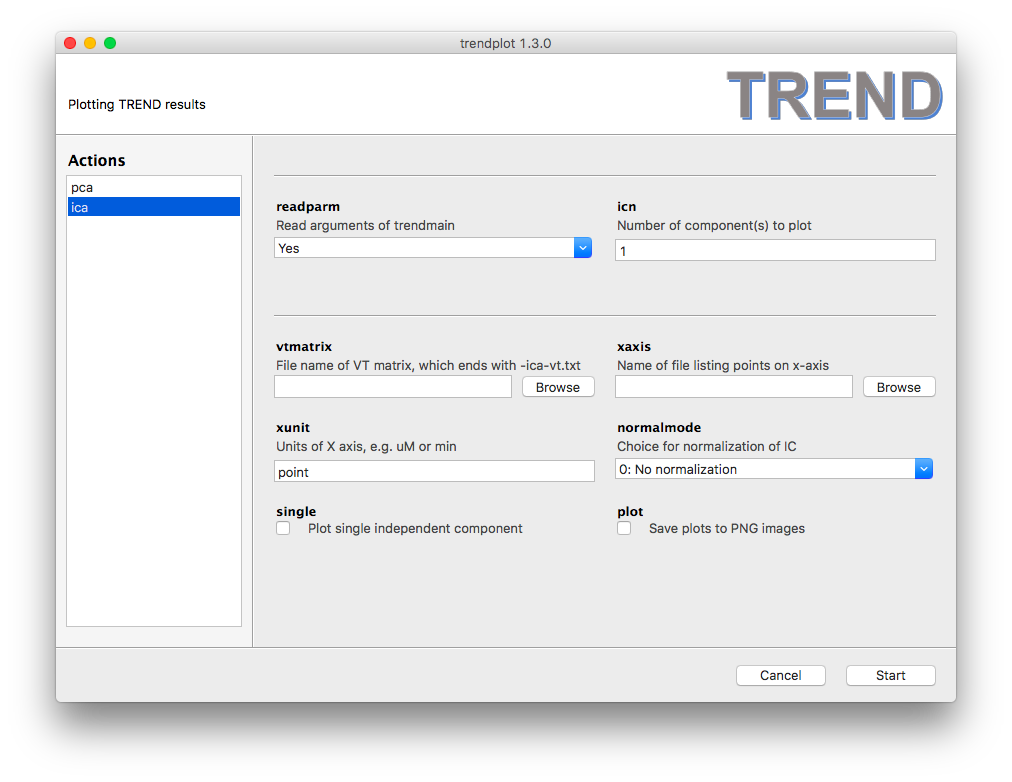
- There are two modes of
trendplotgui: PCA and ICA. It is critical to select
the appropriate mode.
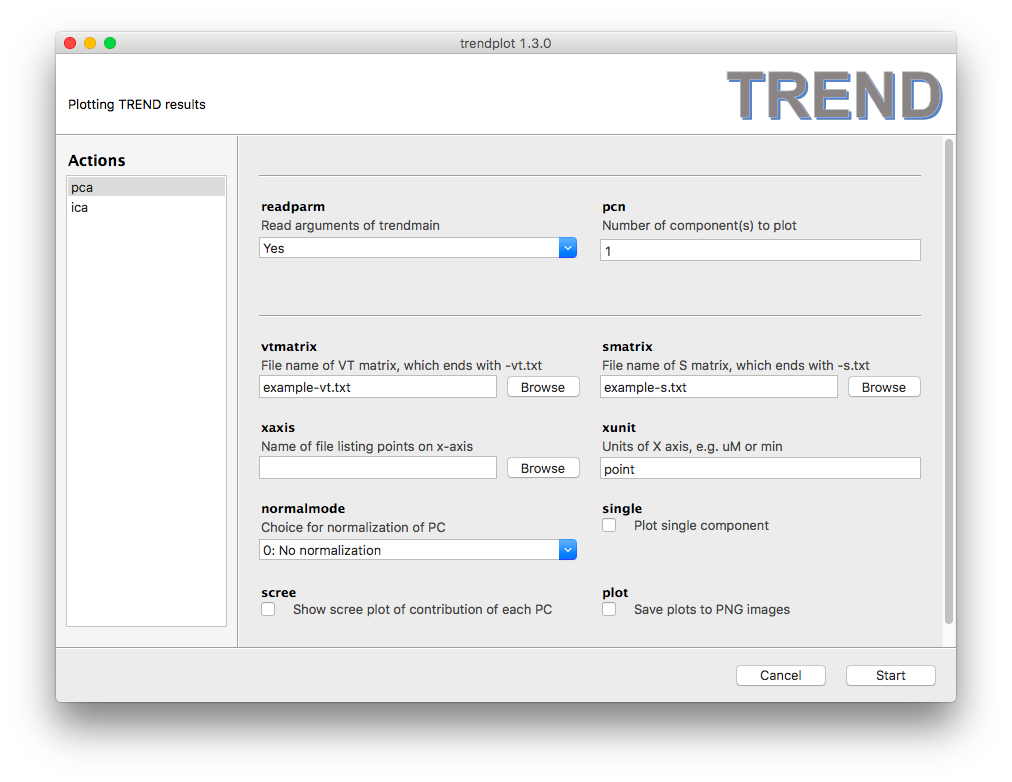
pca mode: The VT matrix and S matrix are needed for plotting PCA results.
These matrices can be selected using the vtmatrix and smatrix file
choosers. However, there is an easier way: Setting readparm to Yes
will read the arguments that trendmain used and automatically locate
the matrices as well as the choices of xaxis and xunit. pcn sets
the first N PCs to be plotted. - When the
single checkbox is turned on,
pcn plots only the Nth PC. The type of normalization can be selected by
setting normalmode according to Table 1 of the manual.
ica mode is very similar to pca mode, but does not read smatrix
or show a scree plot.