TREND NMR - Binding Isotherms and Time Courses Readily from NMR
- TREND NMR is an NMR-optimized improvement upon Trendmain. It requires a minimum of five measurements (collected uniformly) in order to track a trend among them or to make a comparison.
- In the left side bar, there are three modes to choose from:
spectra,fid, andpeaklist. They function similarly, but differ in small ways. - For details of each option, see the GUI manual
and CLI manual).
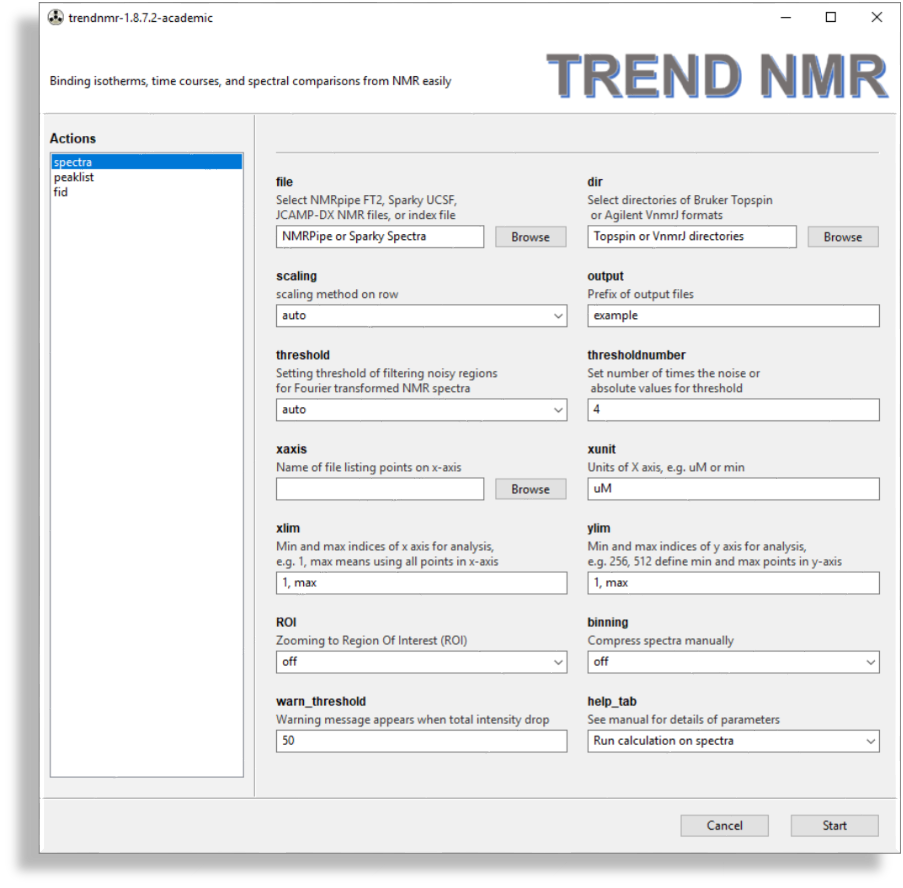
spectra
- Spectra
- The
spectramenu is used for analysis of NMR spectra. It is similar to thenmrmenu of Trendmain. TREND NMRautomatically selects the format of NMR spectra. Under thefileheading, there is a file browsing function for choosing a series of 2D NMR spectra in NMRPipeft2, Sparkyucsf, orjcamp-dxformats.- Under the
dirheading, there is a directory browsing function for choosing a series of directories containing hFourier-transformed Bruker Topspin spectra (brukerspectra)(by experiment number) or Agilent VnmrJ (agilentspectra) - Scaling is important for an accurate binding isotherm. Usually
autois the best choice, but sometimesparetois more accurate. The default scaling method of rows of the data matrix isauto, which is recommended for series of NMR spectra in fast or slow exchange regimes.paretois recommended for spectra with intermediate exchange behavior. Considerations in choosing scaling method and setting the threshold to filter out noise are given in the Supporting Information of Jia Xu and Steven R. Van Doren, Binding Isotherms and Time Courses Readily from Magnetic Resonance. Anal. Chem. 2016, 88 (16), pp 8172-8178 thresholdandthresholdnumbercan be set for filtering noise out of nMR spectra. The three ways to setthresholdareauto,absolute, andthe number of times the noise level. Inautomode, the program determines noise from the first spectrum and set the threshold as 4-fold the noise level forautoscalingand 0.5 times the noise level ofParetoscaling.Compressionof the spectra can be turned on for a faster, more economical calculation, if desired. The number of points to group together can be adjusted interactively using a slider.- The
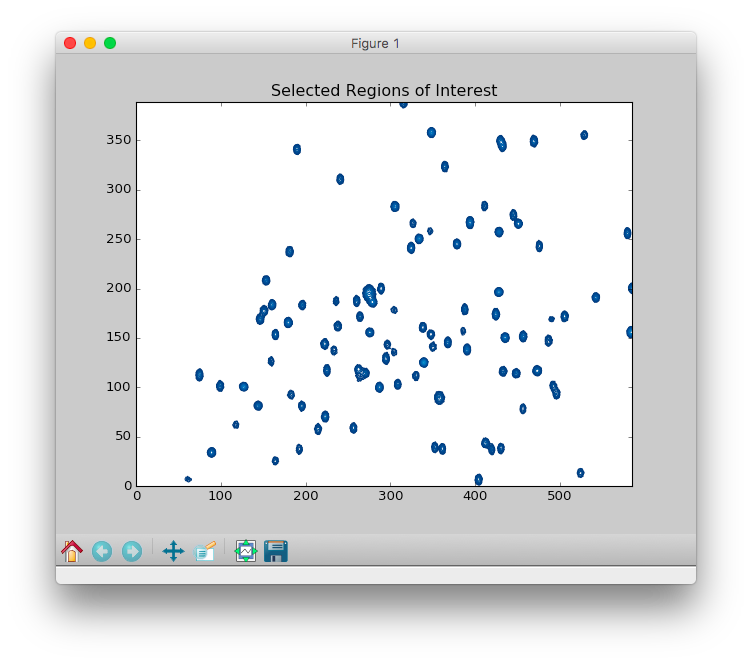
ROIoption allows zooming in on the region of interest (ROI). This is useful for avoiding disruptive spectral artefacts, e.g. from the water or other solvent. When theROIoption is turned on, a preview of the first spectrum in the series will pop up. The ROI can be selected by dragging a rectangular of the spectrum using mouse. After this window is closed, a preview of selected ROI will pop up and be saved as aPNGpicture with suffix of-ROI.pngto the directory of input spectra. - The contour level can be adjusted by dragging the
Contour levelwidget in the bottom of the preview.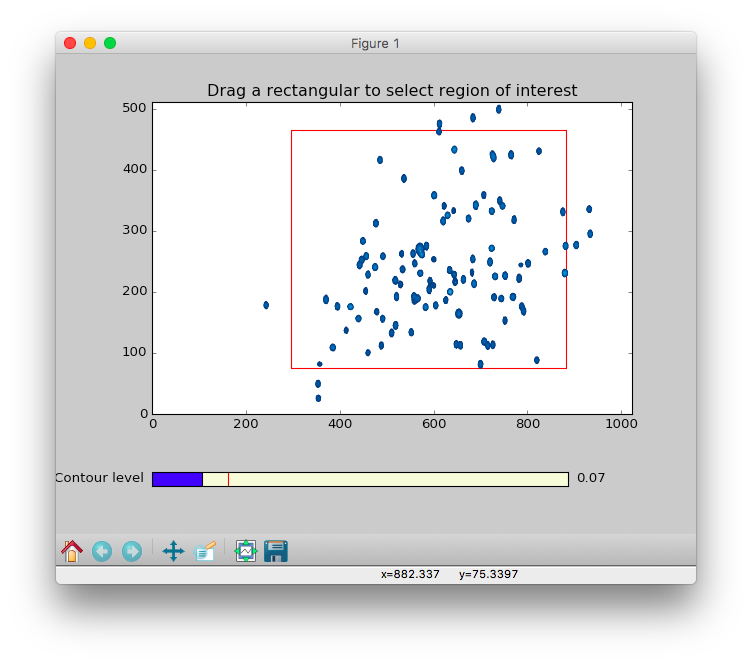
fid
- FIDs
- The
fidmenu is very similar to thespectramenu but should be used if analyzing free induction decays (FIDs). This menu is simplified for handling FIDs, but adds thesolventfilteroption for subtrcting an on-resonance solvent signal. FID files such as NMRPipefid, SimensRDA,JCAMP-DXformats are supported by thefilebrowser. Directories each containing a Bruker Topspin FID (brukerfid) or Agilent VnmrJ FID (agilentfid) can be read by thedirbrowser.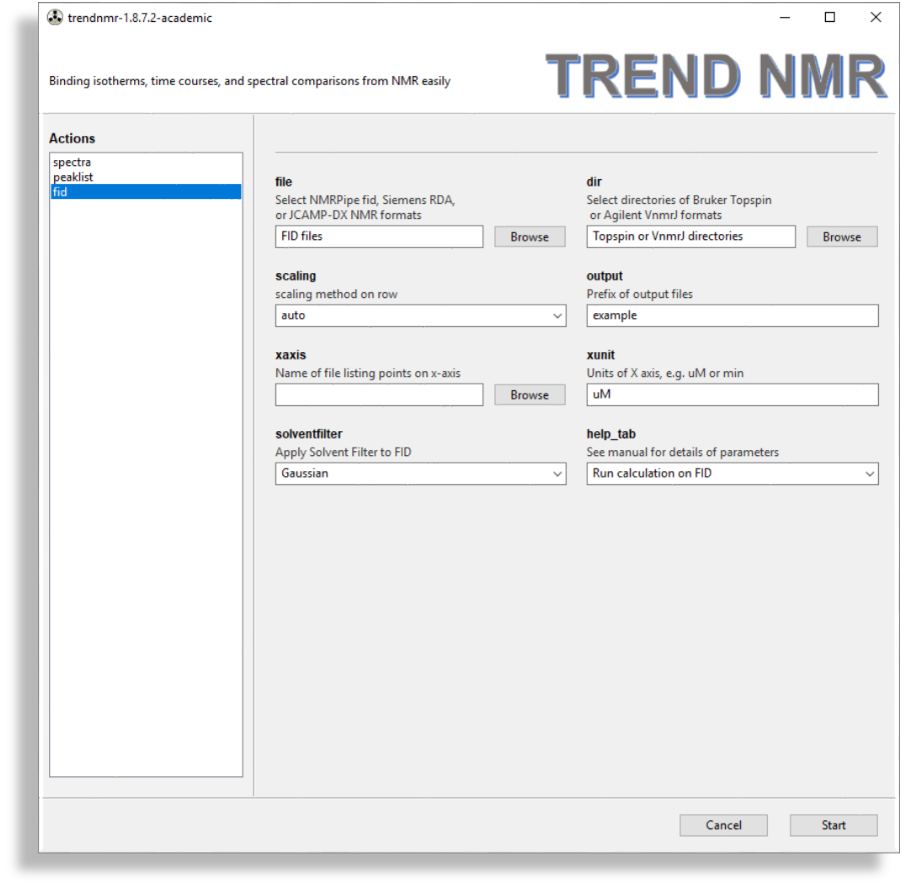
peaklist
- Peaklists
- TREND NMR reads peak lists in
SparkyandNMR-STARformats in itspeaklistmode. Multiple pieces of NMR software can export peak lists inSparkyandNMR-STARformats. TREND NMR can retrieveNMR-STARfiles archieved at the Biological Magnetic Resonance Data Bank (BMRB) when the accession codes are listed in a text file.
It supports the scaling of rows specified in thescalingfield. There is also the option to scale columns, which is specified in thecolumnscalingfield.trendmaingui(the program from the original, general-purpose TREND package) also reads and analyzes lists in Excel, CSV, and text files, any of which would be suitable for peak lists.
- Please configure this if not using 15N HSQC or TROSY spectra: Under
sparky_fields_to_use_and_scale, the default of "N=0.2, H=1" is appropriate for selecting and scaling the correct fields from amide peak lists. (These peak lists are generated from widely used 15N HSQC and TROSY NMR spectra.) For peak lists from 13C-1H correlation spectra such as heteronuclear single quantum coherence (HSQC), heteronuclear multiple quantum coherence (HMQC), and methyl TROSY, a similar choice of "C=0.25, H=1" is suitable. Peak lists from 2D homonuclear 1H-1H total correlation spectroscopy (TOCSY) or nuclear Overhauser effect and exchange spectroscopy (NOESY) could instead be set to "H=1, H=1". handling_of_missing_valuesis used to process NMR peak lists differing in the number of peaks. The default ofremove rows with missing valuesdeletes from the calculation those peaks not present in all of the lists.use mean among spectrahandles missing peaks by filling the mean value from the other spectra.use mean within spectrumsets missing values as the mean of the other peaks in the spectrum.set to zerofills in missing values with 0 for the calculation.alternation_or_combination_of_fieldsorganizes chemical shift data for the calculation. The default option ofinterleave (alternate as H, X, H, X, ....)option reorganizes scaled chemical shift data from each spectrum (scaled by fieldsparky_fields_to_use_and_scale) into a 1D vector for PCA or CONCISE calculation. See Sakurai et al PNAS 2007 104 (39) 15346-1535.
Thecombine (H+X, H+X, ...)option reduces the dimensionality of 2D or multi-dimensional spectra by calculating combined chemical shfit (CCS) use the weighting factor defined insparky_fields_to_use_and_scale. For example, the CCS of HSQC ("N=0.2, H=1") is calculated as . See Boulton et al, Sci Rep, 2014 Dec 8;4:7306.referencing_of_peak_lists_to_first_listThis can be used to reference spectra to the first spectrum in the index file for PCA or CONCISE calculation.
By default, this option is turned off because it assumes the input peak lists are already referenced. TheLinearstyle of referencing is recommended for CONCISE. (See p6511 in Cembran et all PCCP 2014). Referencing using root mean squared (RMS) differences (see Xu et al, Sci Rep, 2016) between peak positions may also be chosen but can decrease the number of peaks retained by CONCISE.
can decrease the number of peaks retained by CONCISE.filter_small_shifted_peakssets the threshold (in ppm) to discard peaks that shift too little. The threshold values are separated by commas in the field calledsparky_fields_to_use_and_scale. The field is by default turned off (0.0, 0.0). Whensparky_fields_to_use_and_scaleis set as defaultN=0.2, H=1andalternation_or_combination_of_fieldsis set to the default ofinterleave, a0.02, 0.02setting offilter_small_shifted_peaksdiscard rows (eitherNorH) whose values vary less than 0.02 ppm across the spectra (i.e. columns). If thealternation_or_combination_of_fieldsis set to 'combine', the first values infilter_small_shifted_peaksis used to filter peaks whose CCS vary less than the threshold (e.g. 0.02 ppm) across different spectra.coordinated_behaviorThis checkbox is checked to turn on CONCISE analysis when start button is clicked at the lower right to start the calculation.TRENDanalysiscan be used to continue and adjust the calculations under the CONCISE tab. For example, the first and last extreme states may be set. The plot can be labeled using a file listing the labels for the peaks. See the CONCISE manual for details.