TRENDset - Batch Fitting of Binding Affinities (or Time Courses)
Description
- TRENDset works on a batch of titrations to determine the binding isotherm and KD of each titration. The set of results are then sorted by KD
- Similar to TREND NMR, TRENDset has two menus,
spectraand `fid, which function similarly. TRENDsetis launched usingtrendset.apportrendset.exe. After the batch run finishes, an HTML report with suffix of-batch_run_result.htmlwill be opened in a browser window automatically.Arguments - Read from an
indexfileindex
UnlikeTrendmainorTREND NMR,TRENDsetcan read most options fromindexfile, which is read byindexFile Chooser Widget.
Theindexfile should be a CSV format spreadsheet. Each column in the spreadsheet contains a parameter for the calculation. The title appears in the first row of the speadsheet. Three arguments are required to be be given in aindexfile. Other arguments are optional.- Required Arguments:
FILE_LOC: File locationFILE_LOCspecifies the location of each file or directory to be used for PCA calculations. It can be given as the absolute path from the root directory, such as/Users/username/data/titration1/1.ucsf.FILE_LOCcan also be a relative path to theindexfile. For example, if an index fileindex.csvis saved as/Users/username/data/index.csv, then the previous1.ucsfcan be given as a relative path from a current directory by listing it as:titration1/1.ucsf.
For Bruker Topspin directories,FILE_LOCshould specify the<expno>level of the directory tree because<expono>/contains a processed spectrum as the1ror2rrfile in its/pdata/1subdirectory. Since the raw data is present in thefidorserfile in the same<expno>directory, thefidmenu can read this raw data by listing the<expno>/directory in the same way. Seebrukerspectraandbrukerfidin Trendmain manual for details.
TRENDset also reads data from Agilent or Varian VnmrJ directories containing anfidfile ordatdir/phasefile. See 'agilentfidandagilentspectra` in Trendmain manual for details.EXP_NAME: Experiment name
TRENDset works on a batch of NMR spectra of titrations or time-dependent measurements.EXP_NAMEnames each titration (or time series) for your convenience.XAXIS: X axis
In theXAXIScolumn, the X axis (e.g. concentration of the ligand) is defined for each file. It will be used as the x-axis values for data fitting. It is the same as thexaxisoptions of Trendmain and TREND NMR.
An example of an index file directing the fittin of two titrations is: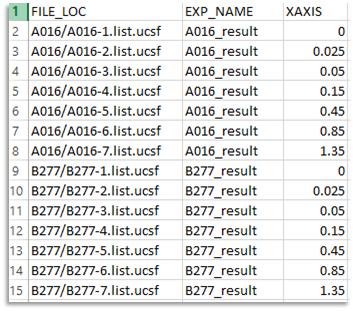
- Optional Arguments for available in TRENDset:
These arguments are optional and most of them can be set in the GUI of TRENDset as "global" arguments. However these arguments can also be defined in theindexfile to overwrite the "global" arguments. Each experiment (EXP_NAME) may have its own optional arguments.
The below arguments are used to do PCA calculation and their details can be found in the Trendmain GUI manual and Trendmain CLI manual.FILETYPE:typeoption intrendmainortrendnmrfor choosing file format. Although TRENDset can determine the file type automatically. the user can also specifyFILETYPEargument. You can use this argument to analyze FID data in thespectramenu of TRENDset.SCALING: This indicates the caling method to apply to rows of the data matrix.Autoscalingis usually preferred. However, in titrations with intermediate exchange broadening, Pareto scaling is preferred because it corrects sigmoidal distortion of binding isotherms. See futhur description of scaling in the documentation of (Trendmain GUI manual and Trendmain CLI manual.COLUMNSCALING: Applies the chosen scaling method to the columns of the data matrix.XUNIT: specifies the units of the X-axis (given byXAXIScolumn in theindexfile).THRESHOLDandTHRESHOLDNUMBER: These are used as described fortrendmainandtrendnmr, in order to filter noise from NMR spectra.BINTIMES: Specify the number of points to be merged together into a single point for the purpose of compressing the spectra for a faster calculation. See the documentation of trendmain and TRENDNMR.SOLVENTFILTER: As described for handling FID signals in the documentation of trendmain and TREND NMR,solventfilterspecifies a funciton to use to subtract the solvent filter signal from the FID.XLIMandYLIM: indices for selecting the region of interest (ROI). These are coordinates in the NMR spectra given as a point index number, in the same fashion as done in Bruker Topspin. See more details in the next section.
- Optional Arguments for data fitting:
FITTING_FUNC: Provides the location files configuring the fitting function. Its format is described below.NORMALMODE: selects the type of normalization, as in trendplot.
- Required Arguments:
Arguments - Read from TRENDset GUI
There are two menus of TRENDset, spectra and fid (shown
below). These are designed to analyze NMR data in the frequency or
time domain, respectively.
As described above and
in Trendmain, preprocessing can be
tailored using scaling, xunit, threshold,
thresholdnumber, xlim, and ylim. If these arguments are not defined
in the index file, they are read by the GUI of TRENDset.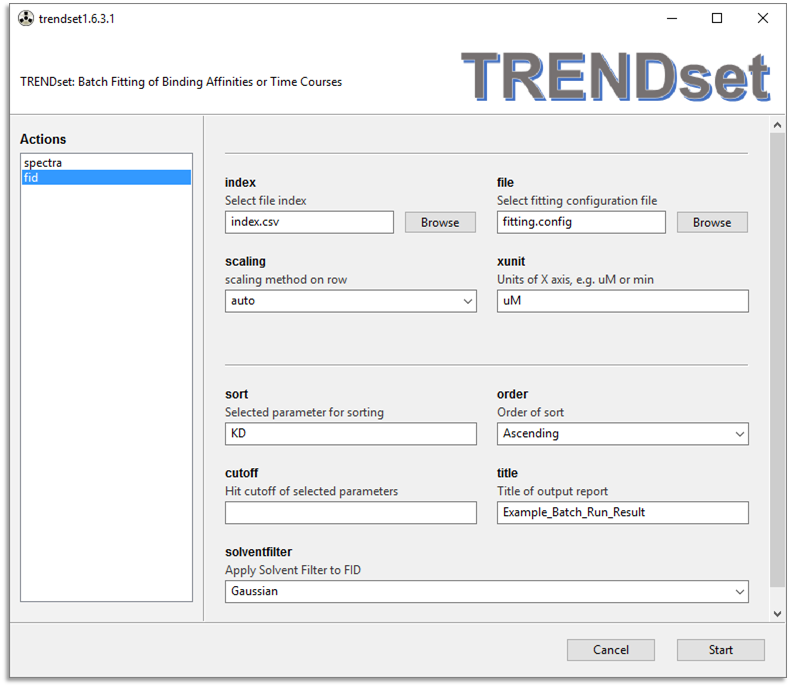
filetext box reads the configuration file for curve fitting. It can be generated by running TRENDanalysis, which generates afitting.configfile in the results folder. Or it can be created by a text editor in the following format (case-sensitive):
Parameters: KD=0.05, y_end=1.0
Constants: Pt=0.05
Function: y_end * 1.0 / (2.0 * Pt) * (KD + x + Pt - sqrt((KD + x + Pt) ** 2
- 4.0 * x * Pt))
This is an example of configuration file used to fit 1:1 protein-ligand binding isotherm.
The line starting with Function is the function for the binding isotherm
in this example.
(Note that it is a function, not an equation):
.
The parameters are defined in the manual for TRENDanalysis.
The line starts with Parameters defines the parameters to fit, while
the values specified here with initial estimates. In this
example, KD, y_end are parameters to fit, while their initial values are
set as 0.05 and 1.0, respectivley. If initial values are not given, then
it will be set as 1.0.
The line starting with Constants defines the constant values that are
fixed in the fitting. Here Pt is fixed to 0.05. The Pt can also be
defined in the Parameters line as a parameter instead of a
constant.
The units of KD and PT must be identical to the units of x-axis, which is
defined by the xaxis argument. For example, if the xaxis option is
set to mM then the units of KD and PT are also mM.
Another example is a configuration file of Exponential function:
Exponential time
Parameters: A, C, T
Constants: None
Function: C + A * exp(-x / T)
The line of Exponential time is a flag that turns on initialization
of parameters defined in the Parameters line. Usually the auto parameter
initialization works fine. Hence, there is no need to list initial
values in the Parameters line. TREND also supports auto parameter
initialization for exponential function rate constant: C + A * exp( -k * x).
To turn it on
just add a line of Exponential rate. The Constants: None line specifies
the absence of constants in the fitting.
sortargument defines which parameter to be sorted in the batch of results. By defaultKDwill be sorted. Note Ifsortis not set, or the parameters set bysortis not found in one or more fitting results, TRENDset will generate a table without sorting selected parameters.orderdefines the order of sorting. By default sorted values will be outputed in the ascending order.cutoffdefines which results are color-coded as a "hit". Values larger thancutoffin a descending order, or smaller thancutoffin an ascending order will be considered as "hits" and colored in green in the generated table.titleis the title of output report. TRENDset will create a result folder namedtitle(with spaces removed if there are any). PCA results, preview of selected ROIs, and fitting results of each experiment will be saved to the subdirectories named asTITLE/EXP_NAME/.XLIMdefines the indices of x-axis points used in the PCA analysis, e.g.1-maxmeans using all points in x-axis.450-500means using points from 450 to 500. The definition of "points" is identical to that used byindexin Bruker Topspin.YLIMdefines indices of y-axis points used for PCA analysis, provided the input data has two dimensions.ROIallows manual selection of ROI. When it is checked, it will turn off theXLIMandYLIMoption. A preview of the ROI will pop up the first spectrum, allowing selection of the ROI manually by dragging a rectangle across the spectrum. See TREND NMR for more details.