COordiNated ChemIcal Shifts bEhavior (CONCISE) analysis using TRENDanalysis
Important
This tab can only be launched after the peak lists have been analyzed via peaklist tab of TREND NMR
Parameters
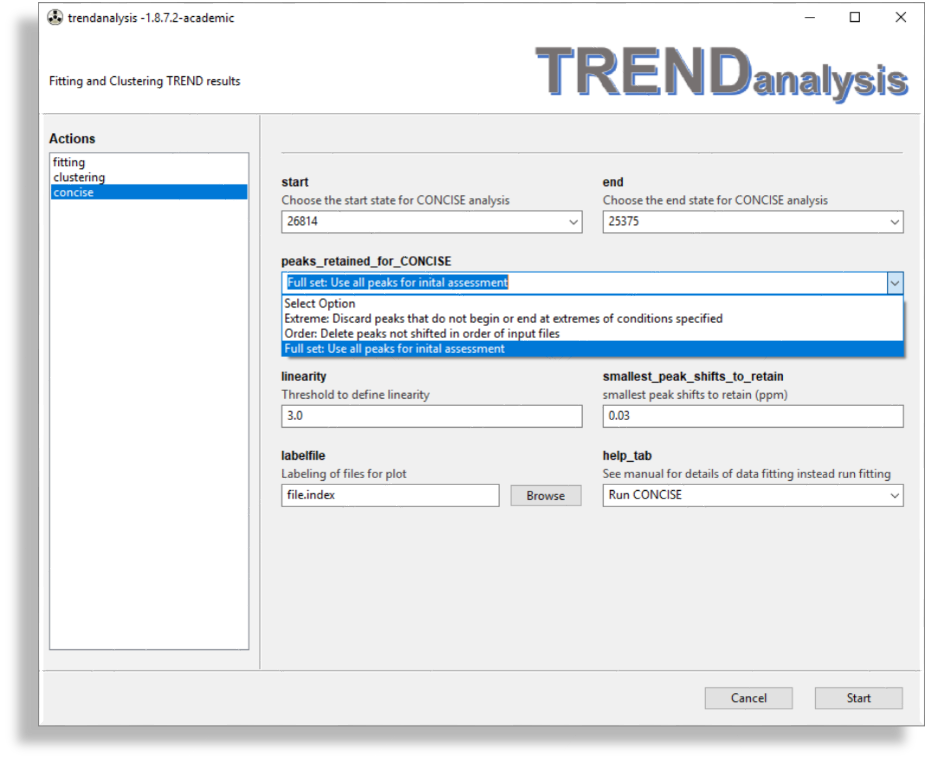
startandendchoose the start and end states for CONCISE analysis. The peak lists were read in thepeaklisttab of tab ofTREND NMRoptions
peaks_retained_for_CONCISEprovides three choices of NMR peaks to retain for CONCISE. The default option is: Extreme:Discard peaks that do not begin or end at extremes of conditions specified. The second option is: Order:Delete peaks not shifted in order of input filesThe third option is Full set:Use all peaks for inital assessmentSee also Interactive Plotlinearity
linearityThe threshold for the degree of linearity. It is defined as SDPC1/SDPC2.
(Cembran et al., 2014). It can also be adjusted by the Slider of Interactive Plotthreshold
smallest_peak_shifts_to_retainThis removes peaks with small shifts along PC1 that are smaller than the threshold (default: 0.03 ppm).
It can also be adjusted by the Slider of Interactive Plotlabelfile
labelfilerefers to the file containg a list of labels for the points. The format of this file is identical tofile.index(See the manual of trendmain for the format offileindex.) Note the sequence in a label file must be identical to its corresponding [fileindex] file. When no file is chosen forlabelfile, TRENDanalysis will use the file names to label the CONCISE.interactive
Interactive Plot
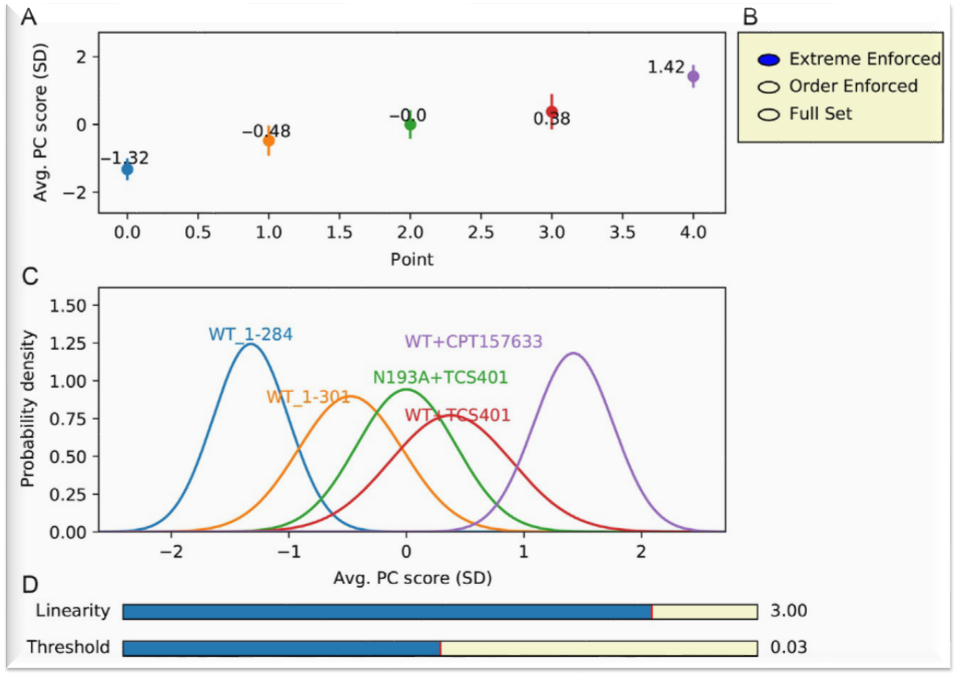
An interactive plot is shown after the Start button is clicked:
(A) The average PC score of NMR peak shifts is the average PC1 for the ensemble of NMR peak shifts, expressed as the number of standard deviations (SDs) of PC1.checkbox
(B) Checkboxes for three choices of NMR peaks to retain for CONCISE are shown. The Extreme Enforced option was used in the example shown. Extreme Enforced selects the subset of residues following the pattern that the peak of the open (unliganded) state lies at one extreme position and the peak of the most closed complex lies at the other extreme (Cembran et al., 2014) . By default extremes are the first and last files in the input files. Other files can be chosen as starting and ending states (i.e., extremes) in TRENDanalysis. The Order Enforced option selects only the subset of residues with NMR peaks that shift in the order specified by the order of the file names of peak lists. Full Set uses all peaks in the assessment. See alsopeaks_retained_for_CONCISElinearity2
(C) The conformational populations are represented by replotting the average PC score as a Gaussian distribution with the SD shown. The threshold for linearity parameter (defined as SDPC1//SDPC2) is also set in the field calledlinearitythreshold2
(D) The interactive slider bars are used to set the thresholds for linearity and size required of the peak shifts. These are displayed with defaults of linearity set at 3.0 SDPC1//SDPC2 and peak shifts at 0.03 ppm. The threshold for linearity is also defined in the field ofthresholdReferences
- Cembran, A., Kim, J., Gao, J., & Veglia, G. (2014). NMR mapping of protein conforma- tional landscapes using coordinated behavior of chemical shifts upon ligand binding. Physical Chemistry Chemical Physics, 16(14), 6508.
- Xu, J, Van Doren, S. (2018). Chapter Seven - Affinities and Comparisons of Enzyme States by Principal Component Analysis of NMR Spectra, Automated using TREND Software Methods in Enzymology
607, 2018, 217-240
You can also read the chapter with the link